
But along this path to certainty, there are two common, immediate and practical challenges faced by data scientists:
- “ How do we get accurate and unbiased data?” and
- “What is the most cost effective way of acquiring this data?”
With the growth of online banking, eCommerce, and mobile commerce, there are myriad sources of high frequency electronic data from which we can derive intelligence for investment, business, or research purposes. For example there are hundreds or even thousands of data sources relevant to retail and real estate such as credit cards, point-of-sale systems, or satellite imagery data and analytics which we wrote about in a Nov 2017 Medium post outlining how it is differentiated and complementary to mobile data.
But for many industries, especially those that deal with physical assets, field information is necessary and fundamental. Examples include agriculture, metals and mining, energy (oil & gas, wind, solar), shipping and bulk transport, defense and intelligence, and insurance. Finding and collecting comprehensive, reliable and comparable data in these sectors can be very difficult and expensive, if it exists at all.
This is where satellite imagery data is most useful, overcoming the challenge of Data Asymmetry by generating independent and objective streams of data where little existed before. With ever increasing numbers of earth observation satellites orbiting the earth, a growing trend for a wide range of industry sectors is to derive intelligence from satellite imagery using advanced machine learning algorithms. I work as a Data Scientist at RS Metrics, the market leading geospatial analytics company, where I’ve often witnessed that a bird’s eye view of the earth can provide more than just a beautiful view, it can provide actionable insights and quantifiable results !
Here are a few ways RS Metrics is using Satellite imagery to derive intelligence in different industry sectors and applications.
Monitoring Industrial Impact of COVID 19
The biggest point of discussion and contention today is COVID 19 and its potential impact on industries. The pandemic has caused a significant impact on the global economy, and no country or industry has been spared, with businesses and industries struggling or on the verge of bankruptcy. There have been numerous models and visualizations to monitor and measure the economic impact of COVID 19 from different data sources, some more reliable than others.
Below is an example of how RS Metrics monitors the impact of COVID 19 through satellite imagery analytics of operations at companies or facilities, in this case Daye Hubei Non Ferrous Metal Plant. The RS Metrics platform tracks historical and ongoing operational activity at thousands of global facilities like this, which provides subscribers with the ability to see changes in employment, production, and raw materials usage in real time.
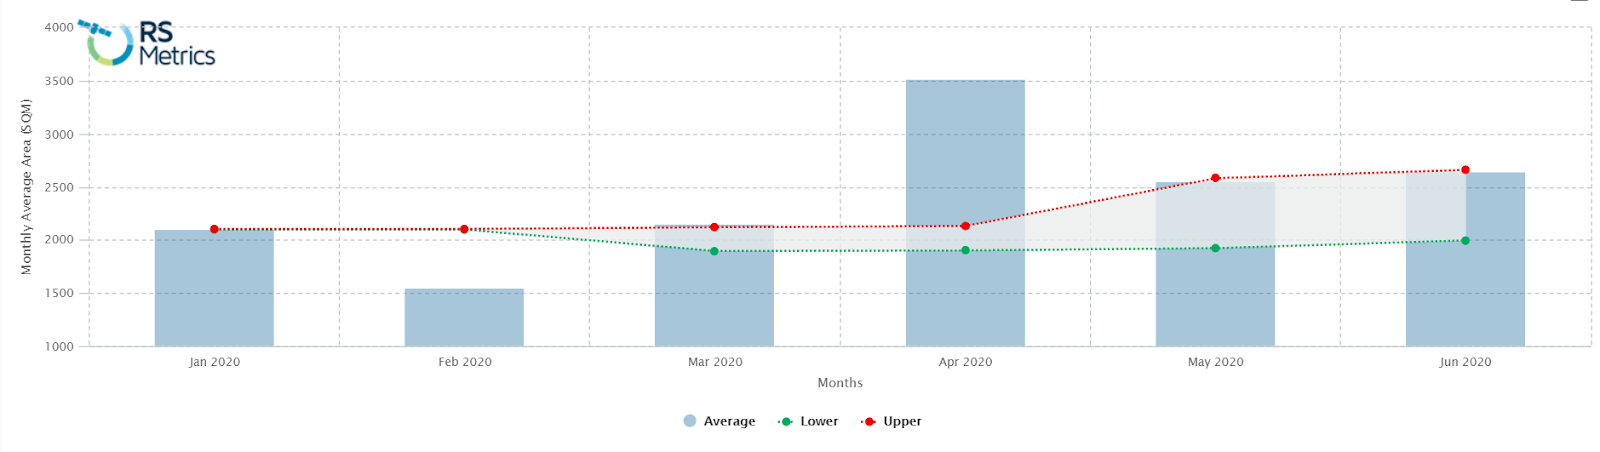
Insights from RS Metrics MetalSignals Application
Daye Hubei Non Ferrous Metal plant is located about 20 miles outside of Wuhan, which is the epicenter of the virus.More than 1000 employees have been quarantined since late January.However, Satellite analytics at RS Metrics shows that the plant is no longer dormant. The above chart shows the fluctuation of metal output observed through imagery in the respective time period and it clearly reflects how the operations at Daye Hubei Non Ferrous Metal plant rebounded in March after quarantine ended in Wuhan.
Determining Global Commodity Supply
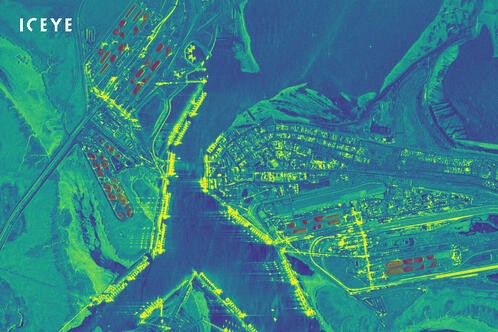
Iron ore stockpiles at the Port Hedland, Australia (Source: https://www.iceye.com/press/press-releases/iceye-and-rs-metrics-enter-into-agreement-to-provide-unmatched-global-iron-ore-stockpile-monitoring)
You might be wondering how possible it is to derive commodity supply just by observing a set of images. But improvements in satellite technology and analytics have now made this possible. Imagery data can be used to measure inventory at smelters and storage facilities by tracking the changes in daily, weekly, and monthly growth in metal concentrates and finished products stored outside.
The RS Metrics MetalSignals Application is specifically designed for this purpose, which aggregates the production and storage data for each location and provides trends and indices by location, metal type and country. Furthermore it generates machine-learning based signals that are predictive of exchange metal price and inventory direction, as well as price direction for hundreds of metals-related equities, indices, currencies/FX (G10 and EM), and interest rates.
Retail and Commercial Real Estate
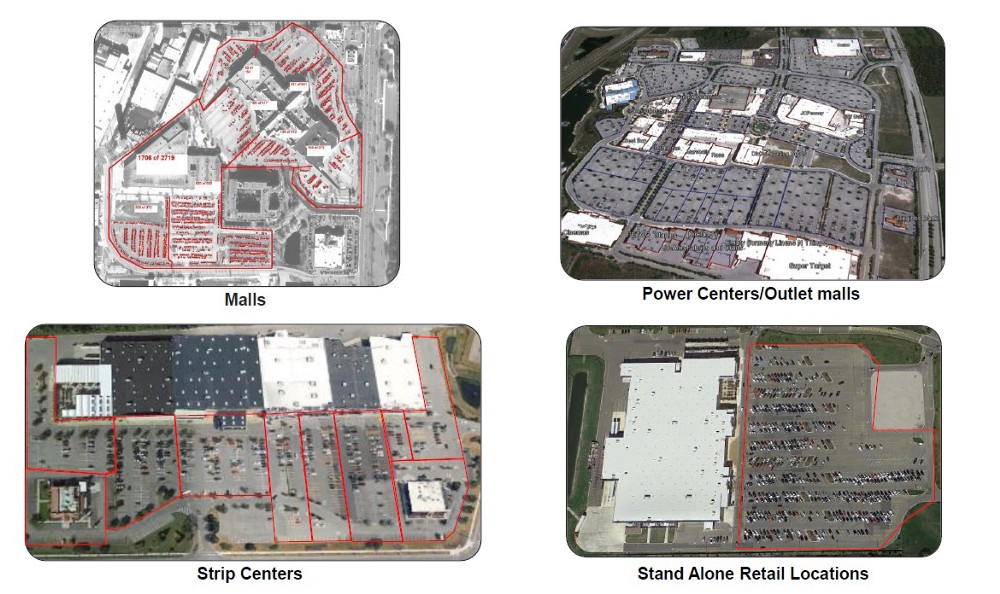
Source : https://learn.rsmetrics.com/trafficsignals/retail/monitoring/special/offer
Using traditional methods to acquire data to determine the activity of large retail chains is undoubtedly a difficult task and is less feasible given that they operate in different locations. The manual data collection procedures require a lot of time, effort and money. RS Metrics TrafficSignals Application has long been monitoring retail locations activity based on parking lot traffic. Fluctuations and signals based on traffic measurements are predictive of monthly and quarterly reported revenue and often even stock price. Insights and information can be used by retailers and investors to make informed decisions.
Measuring the level of Economic Activity
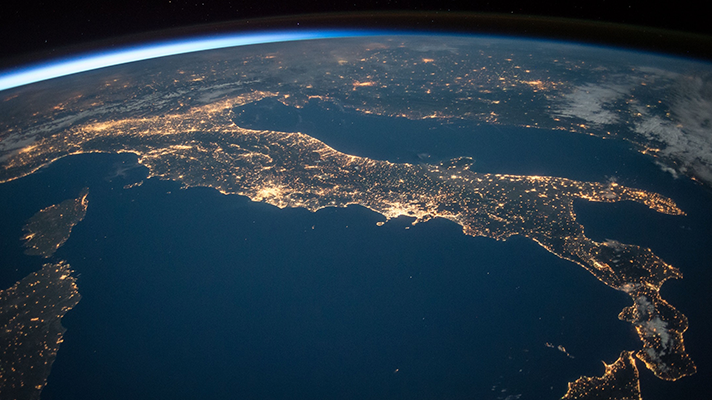
Illuminating Economic Growth (Source :https://www.imf.org/external/pubs/ft/fandd/2019/09/satellite-images-at-night-and-economic-growth-yao.htm)
The economies are typically measured via several economic indicators which are often derived using census and other forms of self reporting which could have several loopholes and will be difficult to project. In contrast satellite imagery enables us to see how economies grow and shrink in real time. Tracking the amount of new constructions or identifying the change in the number of ships in and out from ports , tracking nighttime activity are few out of many aspects that reflect the economic status of a country.
RS Metrics currently monitor several economic indicators such as the PMI and GDP along with the metal production data gathered from satellite imagery. And these analyses have revealed correlations between different indicators with the satellite imagery data which were significant in making certain informed decisions in the industry.
Tracking Changes in the Environment
One of the finest use cases of satellite image analytics is Land Use and Land Cover change detection to identify illegal deforestation. Furthermore the imagery are used to detect changes in the air quality level. The following image shows the Daily analyses of pollutant concentrations via Copernicus Atmosphere Monitoring Service (CAMS) which reflects a gradual reduction trend of NO₂ in northern Italy as a result of lock down due to COVID 19.
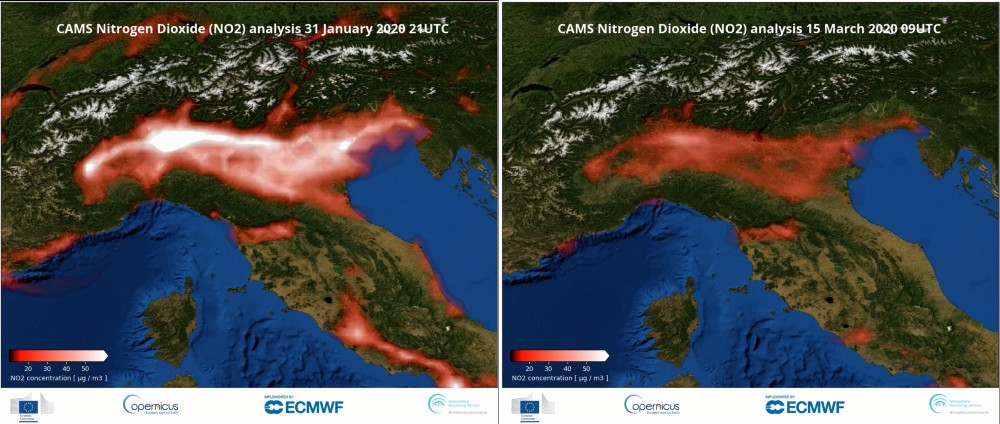
Surface concentrations of nitrogen dioxide over northern Italy, comparison between 31 January and 15 March 2020. (Credit: Copernicus Atmosphere Monitoring Service (CAMS); ECMWF)
Likewise, high resolution imagery enables us to detect and extract change features. Then several training datasets are created including these identified change features. These collected data are then subjected to analysis across both locations and time (i.e. Spatio Temporal Analysis) to derive more meaningful insights.
In addition, Satellite Imagery is frequently used to detect and track the human, economic, and environmental impact of natural catastrophes such as earthquakes, floods, or fires. It allows us to get the ground-truth about the state of the affected areas in almost real time. More precisely through satellite imagery we can track the affected number of people, the extent of infrastructure damage and the progress of the rescue operations especially in physically inaccessible areas. We used a novel parcel-based inventory approach to quantify wildfire damage with satellite and aerial imagery to track the impact of the 2018 California wildfires.
Intelligence derived through the analysis of above environmental signals are used to generate insights on ESG factors which are increasingly driving investment decisions. RS Metrics provides real time insight benchmarks, land usage and forest coverage comparisons,API access to ESG benchmarks and monitoring of ESG contributing issues through it’s ESGSignals Application. More Precisely it provides the opportunity to :
- Monitor critical ESG issues and factors for assets,companies, industries and countries
- Provide Ground-truth, verified and bias-free insights on ESG issues for potential investments
- Provide Real-time benchmarks on ESG factors across the Opportunity value chain of a brand / product
- ExploreLand usage, emissions, water stress, employment & production trends
- Provide API access to ESG benchmarks on our platform for third party integrations
In addition to the major applications I’ve described above, Satellite Imagery and related analytics can be used in several scenarios in diverse domains. Imagery based analytics outsmart analytics based on traditional data as it provides objective, unbiased real time insights and helps to overcome subjective, outdated, or out-rightly false narratives. The symbiotic combination of high quality imagery and advancements in Data Science provide a novel set of analytics for investors to think and act.
So, it’s time to grasp the true potential of satellite imagery and Geo spatial analytics and rewrite the rules of investing !
To learn more about RS Metrics please visit our website .You can also follow recent developments on Twitter , Facebook and LinkedIn.
Written by Kethmi Hettige